Silver's 3.3% Drop—The Structural Shock Behind Gold's Smaller Slide
 By John Nada·May 27, 2026·5 min read
Silver plunges 3.3% due to structural weaknesses, outpacing gold's 1.6% drop, driven by industrial demand ties and lack of central bank support.
Silver tumbled 3.3%, closing at $74.42 per ounce, shedding $2.55 while gold lost 1.6%, landing at $4,437 per ounce. As GoldSilver.com reports, this isn't just random noise—it's structural. Over half of silver's demand—58% to be exact—comes from industrial uses like solar panels and medical devices. Gold? Zero from factories.
Silver's thinner market and lack of a central bank safety net mean it has fewer cushions when selling pressure mounts. The London Bullion Market Association shows that gold's trading volume dwarfs silver's, absorbing shocks more gracefully. When the U.S. military's strikes in Iran stirred geopolitical anxiety, oil prices rose and the dollar strengthened, pushing investors away from risk assets, amplifying silver's volatility.
The catalyst for the drop in silver prices was geopolitical tensions. The U.S. military conducted self-defense strikes in southern Iran, even as negotiations for a 60-day ceasefire were underway. This geopolitical unrest caused oil prices to rebound and the dollar to strengthen, leading investors to rotate out of riskier assets like silver, which further exacerbated its volatility.
GoldSilver.com highlights that while 70% of silver's supply arises incidentally from other mining operations, gold enjoys a stable demand floor with central banks buying over 1,000 tonnes annually through 2024. That institutional safety net keeps gold more stable amid market jitters. Silver, standing on its industrial legs, stumbles harder.
The silver market's been running at a supply deficit for the sixth year, with a projected 46.3 million ounce shortfall in 2026. Even when prices dive, supply doesn't react—70% of silver comes as a byproduct of other metals' mining, which stays steady regardless. So, each downturn removes silver from an already shrinking stockpile.
Historically, silver's dual identity as both a monetary metal and an industrial commodity leads to a unique market behavior. Approximately 58% of the world’s annual silver demand is tied to industrial applications, such as solar panels, electric vehicles, data centers, and medical devices. This industrial demand premium unwinds quickly during economic uncertainty, as manufacturers become cautious about supply chains and industrial buyers pull back. Meanwhile, gold, which is primarily a monetary metal, does not experience this dynamic. Its demand remains steady since it is not tied to manufacturing activities.
Additionally, silver's market is considerably thinner than gold's. According to data from the London Bullion Market Association and CME Group, gold's daily cleared volume is ten to fifteen times larger than silver's. This means that the same dollar amount of selling pressure results in a much larger percentage move in silver. When institutional traders reduce their exposure to precious metals, silver's price movements are more pronounced, experiencing greater fluctuations in both directions.
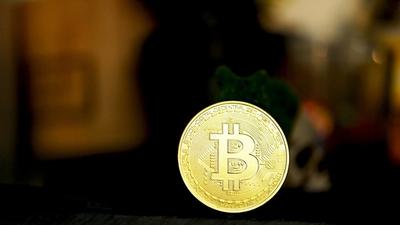
Central banks do not hold silver as part of their reserves, unlike gold. The World Gold Council reports that central banks purchased over 1,000 tonnes of gold annually for three consecutive years through 2024. This sustained institutional demand creates a structural floor for gold, providing a buyer of last resort during times of selling pressure. In contrast, silver lacks this support, making it more susceptible to price drops.
Despite these challenges, there is a silver lining. The same forces that drag silver prices down also enable swift recoveries. When geopolitical tensions ease or macroeconomic data softens, silver tends to rebound faster than gold. The thin market that amplifies its fall also amplifies its recovery. Historical data from the Silver Institute and Metals Focus indicates that patience pays off after silver's biggest single-day drops. The market is experiencing its sixth consecutive year of supply deficits, with a projected 46.3 million ounce shortfall in 2026.
Importantly, about 70% of the world's silver supply is a byproduct of mining other metals like copper, lead, and zinc. When silver prices fall, mine supply does not significantly increase because these mines are not primarily focused on silver production. This means that above-ground stockpiles are drawn down year after year, and each price pullback removes metal from an already shrinking pool.
Should you buy silver during a pullback? The answer depends on your investment horizon. For a day trader, today’s 3.3% drop is simply a data point. However, for long-term investors who understand the fundamentals — a metal with six consecutive years of supply deficits and where 70% of new supply cannot respond to price signals — the picture looks different. Today’s price is $74.42, a significant drop from around $33 a year ago.
Consequently, silver’s volatility isn’t a warning; it’s a mechanism. The dual nature that amplifies the drop also amplifies the recovery. Understanding this distinction, rather than panicking at headlines, is what separates informed allocations from reactive ones. Tomorrow's economic data — Q1 GDP, PCE inflation, jobless claims — will test these metals' resilience. If the data runs hotter than expected, precious metals might face another wave of selling pressure. Conversely, if it cools, the recovery trade could be swift, with silver moving first and farther.
In essence, owning silver requires an understanding of its fundamental market dynamics and the patience to weather its inherent volatility. The same structural weaknesses that drive its price down can lead to significant gains when market conditions stabilize.