Gold's Roller Coaster: Inflation, Central Banks, and Real Rates
 By John Nada·May 16, 2026·3 min read
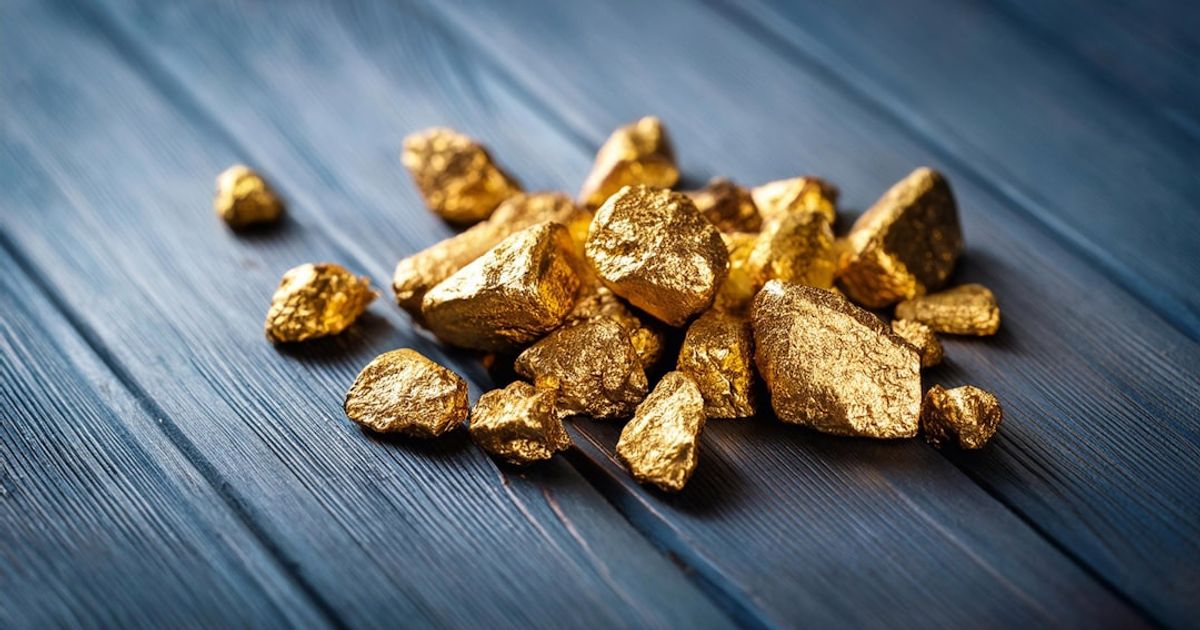
Gold's price dynamics hinge on inflation, central bank buying, and real rates. Recent trends reveal an intertwined dance of these factors.
Gold hit an all-time high of $5,589 per ounce in January 2026, only to slide back to around $4,550 by May. An 18% drop could sound alarming, yet the metal's price had more than doubled over the past year. Understanding why requires more than watching the daily ticker.
Real interest rates are short-term gold price kingmakers. GoldSilver.com reports that as real rates turned negative, gold's opportunity cost dropped, enticing investors. But by May, markets had erased hopes for rate cuts, even hinting at a December hike. Such shifts pressured gold, evidencing its sensitivity to real interest rates. The 2020-2022 period exemplified this when deeply negative real rates fueled one of gold’s strongest multi-year rallies on record.
Yet, don't count out inflation. When consumer prices spike, gold's allure as a value store spikes too. But April 2026's 3.8% U.S. CPI had a twist. Anticipations of Fed rate hikes bolstered the dollar, temporarily squeezing gold. It's a cyclical dance—hot inflation, hot dollar, cold gold. This cyclical nature is rooted in gold’s inability to expand supply through policy, contrasting with fiat currencies whose purchasing power can erode through inflation.
And about that dollar. Gold's priced in greenbacks, which means a stronger dollar can make gold dearer in other currencies, throttling demand. This inverse relationship is a staple, though it can crumble under financial stress. Think 2008 or 2020, when both surged together as safe havens. The more significant long-term dynamic, however, is the dollar’s purchasing power rather than its exchange rate against other currencies.

First Majestic Sells San Martin Mine for $90 Million—Strategic Shift Underway
First Majestic sells San Martin Mine to Flextronics for $90M—signaling a strategic shift.
Central banks don't chase trends—they set them. Since 2022, their gold purchases have soared, averaging over 800 tonnes annually, nearly double the previous decade's pace. GoldSilver.com notes this is a structural strategy, building reserves as a hedge against dollar-denominated assets. Even in 2025, global banks snagged 863 tonnes, solidifying a demand floor. This structural demand from central banks acts as a buffer, supporting gold prices even when Western investors sell.
Geopolitics can't be ignored either. Early 2026 saw gold peaking due to Middle East tensions and global trade jitters. But here's the kicker: 68% of central banks now house gold locally, reflecting a strategic mistrust in foreign stores. This isn't headline-driven; it's a deliberate shielding move. The pattern holds broadly: fear premiums spike quickly and fade just as rapidly.
Physical supply lumbers at its own pace. Gold extraction can't sprint with price spikes due to geological and bureaucratic constraints. Although global mine output hit a record 3,672 tonnes in 2025, demand dynamics told another story. Investment demand, chiefly bar and coin buying, surged, even as high prices deterred jewelry purchasers. Bar and coin buying reached a 12-year high in Q4 2025, contributing to a record total gold demand of over 5,000 tonnes for the year.
So, which factor holds sway? Real interest rates take the short-term trophy, while central bank purchases and inflation offer long-term support. Gold's narrative isn't static; it's a reflection of broader economic ebbs and flows. The interplay among these factors creates a complex landscape for gold prices, with each element adding its own influence over different time horizons.
Understanding these dynamics helps investors make informed decisions, recognizing that the factors driving gold prices are intertwined rather than isolated. The persistent structural forces, such as central bank purchasing and inflationary pressures, provide a foundation for long-term support in gold prices, despite the short-term fluctuations driven by real interest rates and the dollar’s strength.